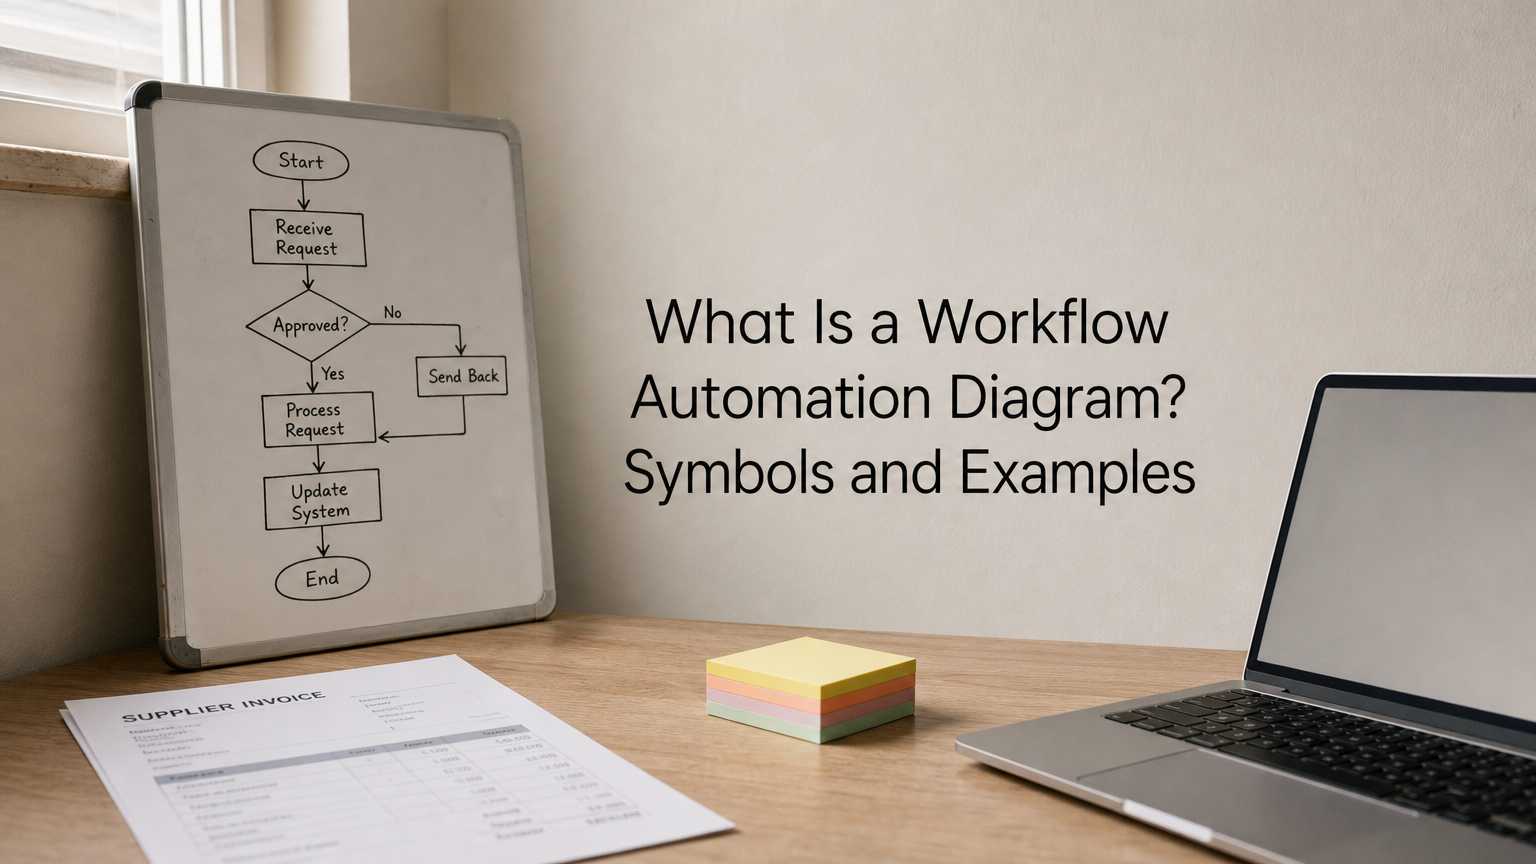
A workflow automation diagram is a visual map of a process that shows every step, decision and handoff, and marks which steps run automatically and which still need a person. It turns "how we do things" into something you can see, question and build from. The diagram is the plan, and the automation tool is the builder.
This article explains why the diagram matters, which symbols to use, how to draw an automation workflow diagram from scratch, and how to pick the steps worth automating. You also get two worked examples and a fill-in template you can copy into any flowchart tool or spreadsheet.
At QuikeFix, our delivery starts with discovering the process, users, risks and integrations before we propose a solution.
Why a workflow automation diagram matters
A workflow automation diagram matters because it shows the process as it really runs before you spend money automating it. Automating an unclear process only makes the confusion happen faster.
It exposes waste and handoffs
Drawing forces you to list every step, and that is where handoffs, rework loops and duplicate data entry show up. Ask three people how invoices get approved and you will often get three answers. The diagram settles the argument.

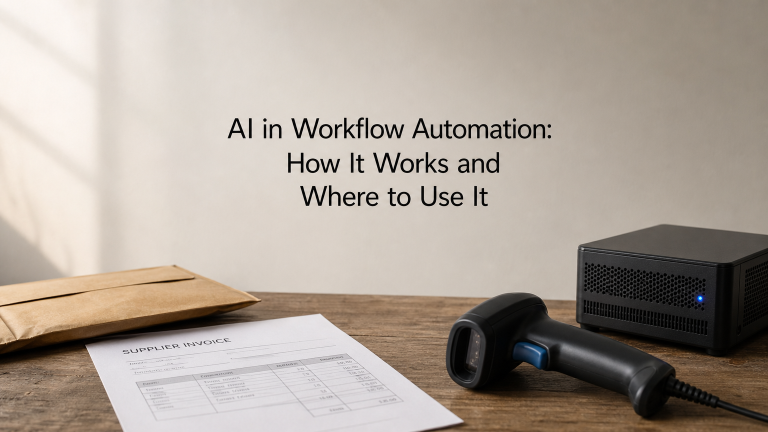
Here is a worked example. A finance clerk handles 40 supplier invoices a week and spends 6 minutes on each one retyping details into the accounting system. That is 240 minutes, or 4 hours a week. Over 50 working weeks it adds up to about 200 hours a year. On a diagram, that cost is one box with one arrow, and it is obvious what to automate first.
It gives everyone one version to agree on
Operations, finance and IT usually see different parts of the same process. A shared diagram gives them one agreed version to review before anything is built, so you catch missing approvals and unclear owners on paper, where fixes are free.
Later, the diagram becomes your documentation. When an automation fails, you can trace the flow and find the step that broke instead of guessing.
Automate a process only after you can draw it on one page.
Symbols to use in a workflow automation diagram
Use five core flowchart shapes, then add a few automation markers of your own. You do not need full BPMN notation to get a useful diagram. You need a small set of symbols that your whole team reads the same way.
Core flowchart shapes
These are the standard flowchart shapes. Every flowchart tool offers them.

| Shape | Meaning | Example label |
|---|---|---|
| Oval | Start or end of the process | "Invoice received" |
| Rectangle | An action or task | "Extract invoice data" |
| Diamond | A decision with yes/no branches | "Amount under R10,000?" |
| Parallelogram | Data going in or out | "Upload proof of delivery" |
| Arrow | Direction of flow | Links one step to the next |
| Small circle | Connector to another page | "Continue on page 2" |
Automation markers
The next markers are conventions, not formal standards, so define them in a legend on the diagram. A trigger is the event that starts the workflow, such as a form submission, a new email or a status change. Tools like n8n use trigger, condition and action nodes, so a clean diagram translates almost directly into a build.
Use a colour or an "A" and "M" tag to show automated versus manual steps. Add a clock symbol for waits and delays, and a dashed arrow for error paths. Finally, use swimlanes, one horizontal band per person or system, so owners are clear.
Pick one set of symbols, add a legend, and keep it the same across every diagram you draw.
How to create an automation workflow diagram
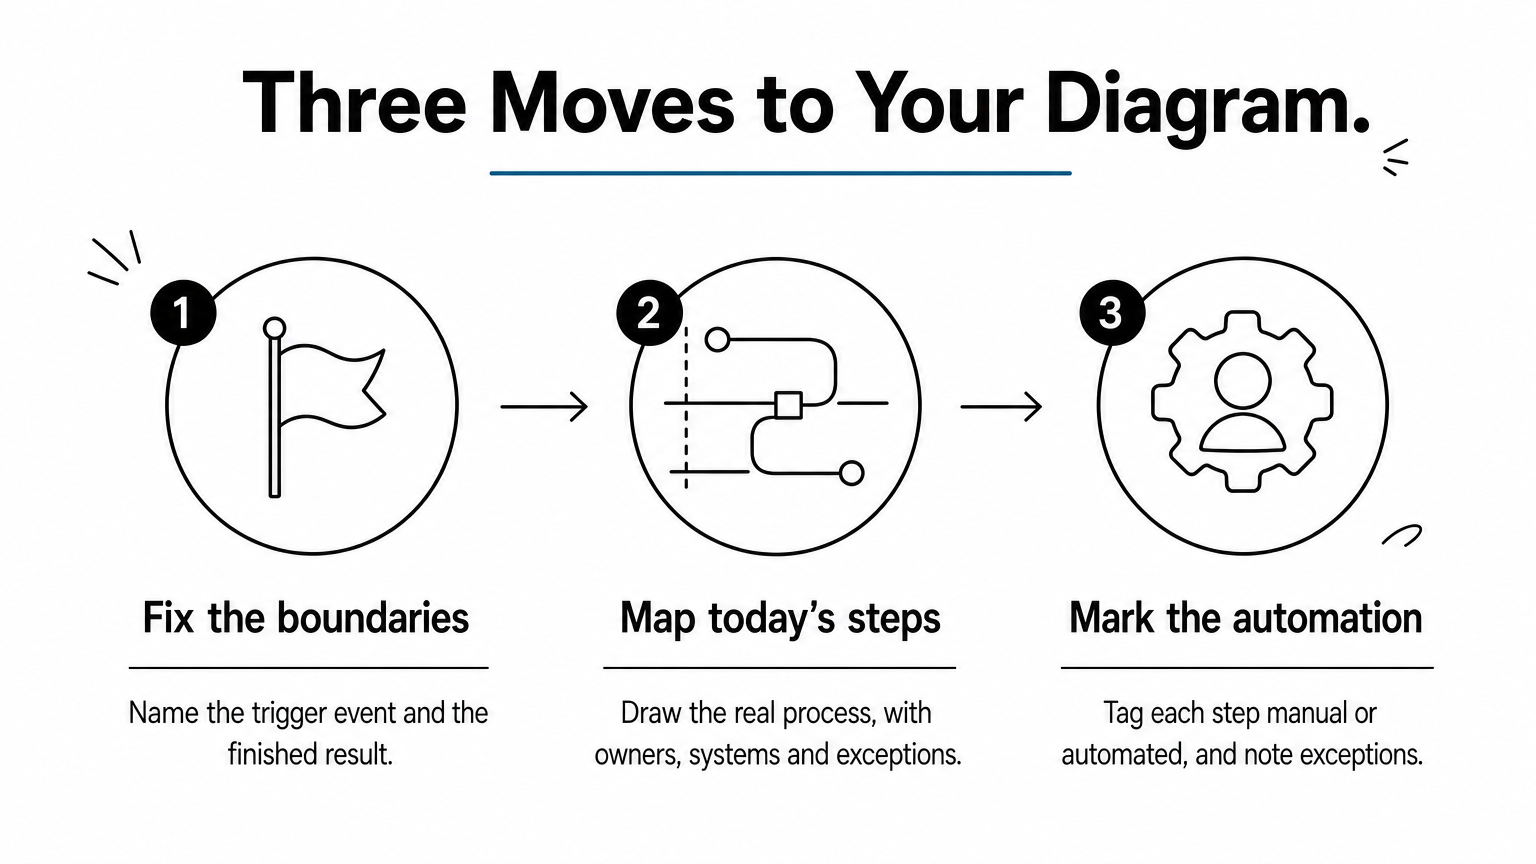
Create the diagram in three moves: fix the boundaries, map what happens today, then mark where automation goes. A whiteboard works for the first draft. Move it into a flowchart tool once the team agrees.
Define the trigger and the finish line
Start with two questions. What event starts this process, and what does a finished result look like? For invoices, the trigger is an invoice arriving and the finish line is "posted and paid". A process with no clear start and end turns into a sprawling map nobody uses.
Map the steps as they run today
Map the real process, not the one in the policy document. Talk to the people who do the work.
- Write each action as a verb and an object, such as "check amount".
- Put every action in the lane of whoever does it.
- Turn every "it depends" into a diamond with labelled branches.
- Add the system or document used at each step.
- Draw what happens when something goes wrong.
Mark automation and exceptions
Now tag each step as manual or automated and note the exception route. A simple table works as a reusable template, and you can copy the headings into a spreadsheet:
| Step | Trigger or input | Owner | Manual or automated | Tool | Exception path |
|---|---|---|---|---|---|
| 1 | Invoice email arrives | Finance | Automated | Email + workflow tool | Send to inbox review |
| 2 | Match to purchase order | System | Automated | Accounting system | Flag to finance |
A diagram is finished when every step has an owner and every decision has an exit.
How to spot which steps to automate
Automate steps that are frequent, rule-based and use structured data. Keep steps that need judgement or relationships in human hands. Run each step on your diagram through the same test.
Score each step against five criteria
| Criterion | Good candidate | Keep manual |
|---|---|---|
| Frequency | Daily or weekly | A few times a year |
| Rules | Clear if/then logic | Depends on judgement |
| Data | Structured fields, a form or an API | Free-text, scans, phone calls |
| Stability | Process rarely changes | Changing every month |
| Systems | Tools can connect via API | No access or integration |
Steps that pass four or five checks go on your first automation list. In the invoice example, data capture passes every test. An approval above R10,000 does not, because a person should decide it.
Keep people on the exceptions
The best automation is rarely all or nothing. Let the workflow handle the routine path and route exceptions to a person with the context attached. Start with one workflow, measure it, then expand. Outcomes depend on process design, data quality and adoption, so check the result against the diagram you drew.
Automate the routine path and route the exceptions to a person.
Workflow automation diagram examples
Two examples show how the symbols and markers combine. Both are illustrative, so adapt the thresholds and names to your own business.
Supplier invoice approval
This diagram uses a decision at the match step and another at the amount. The R10,000 limit is an example.
[Start] Invoice arrives by email            (trigger, automated)
   -> Extract supplier, amount, PO number    (automated)
   -> <Matches purchase order?>
        No  -> Send to finance for review    (manual) -> [End]
        Yes -> <Amount under R10,000?>
                 Yes -> Auto-approve -> Post to accounting (automated) -> [End]
                 No  -> Manager approval      (manual) -> Post to accounting -> [End]
Proof of delivery in freight
Freight teams can map delivery confirmation the same way. The trigger is a job status change to "delivered", and a decision asks whether the proof of delivery (POD) is attached.
- Job marked delivered (trigger).
- Is the POD attached? If yes, email the POD to the customer automatically.
- If no, wait 24 hours, then notify the dispatcher (manual follow-up).
- When the POD is uploaded, send it and close the job.
For warehouse flows, map the full chain of custody. In QuikeFix Freight ERP that runs from security entry through receiving, stock, dispatcher release and security exit to POD.
The best example diagram is your own process, drawn on one page with every exit marked.
Draw it first, then automate
A workflow automation diagram shows your process on one page, with every step, decision and owner visible and the automated steps marked. Use simple shapes, add a legend, score each step, and keep people on the exceptions. Then you know what to build and why.
If you want help turning a diagram into a working automation, talk to QuikeFix about mapping and automating your process. We start with discovery, design the workflow with you, then implement, test and train.